Source: http://neoharmonics.com
Fibonacci numbers play a critical role in the formation of the harmonic patterns, so it’s important to have an understanding of both.
Fibonacci numbers play a critical role in the formation of the harmonic patterns, so it’s important to have an understanding of both.
Leonardo of Pisa was known as the “greatest European mathematician of the middle ages”. He was born in Italy in about 1175 AD (not to be confused with Leonardo da Vinci, who lived about 200 years after the death of Leonardo of Pisa).
He was known by a handful of names, one of which is “Fibonacci”. Some think this name came from shortening of the Latin “filius Bonacci”, used in the title of his book “Libar Abaci”.
We shall just call him Fibonacci, as do most modern authors, but if you are looking him up in older books, be prepared to see any of the above variations of his name.
Fibonacci had many accomplishments, including being one of the first people to introduce the Hindu-Arabic number system to Europe, the positional system we use today, based on ten digits with its decimal point and a symbol for zero (1 2 3 4 5 6 7 8 9 0). However, we will focus on his accomplishments as they pertain to what we are interested in… trading!
In Fibonacci’s Liber Abaci book, chapter 12, he introduces the following problem (here in Sigler’s translation – see below):
How Many Pairs of Rabbits Are Created by One Pair in One Year?
A certain man had one pair of rabbits together in a certain enclosed place, and one wishes to know how many are created from the pair in one year when it is the nature of them in a single month to bear another pair, and in the second month those born to bear also.
He then goes on to solve and explain the solution:
Because the above written pair in the first month bore, you will double it; there will be two pairs in one month. One of these, namely the first, bears in the second montth, and thus there are in the second month 3 pairs; of these in one month two are pregnant and in the third month 2 pairs of rabbits are born, and thus there are 5 pairs in the month;
…
there will be 144 pairs in this [the tenth] month; to these are added again the 89 pairs that are born in the eleventh month; there will be 233 pairs in this month. To these are still added the 144 pairs that are born in the last month; there will be 377 pairs, and this many pairs are produced from the abovewritten pair in the mentioned place at the end of the one year.
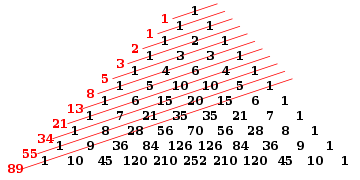
Ultimately, this leads up to the “Fibonacci Series”: 0, 1, 1, 2, 3, 5, 8, 13, 21, 34, 55, 89, 144, 233, 377, 610, 987, 1597, etc. where each number is the sum of the two numbers that precede it. History is blurry on whether Fibonacci actually invented this problem or series (history points to Indian mathematics). In any case, it now bares his name.
This Fibonacci series is also illustrated in Pascal’s Triangle.
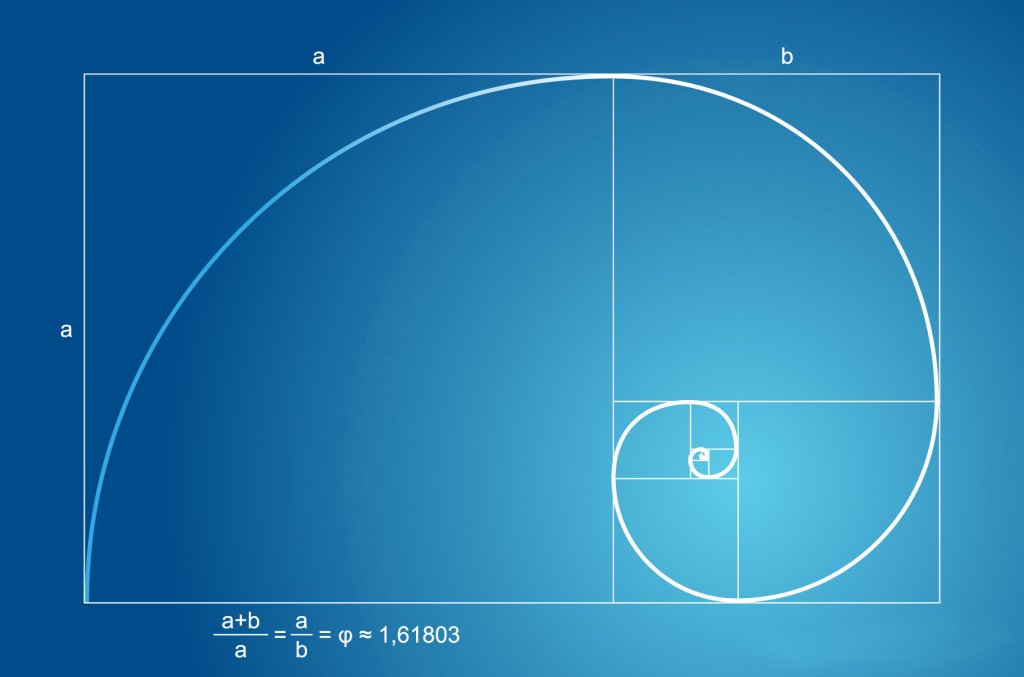 As these numbers grow in size, the relation of any pair of numbers gets closer and closer to the “golden ratio” (also known as the “golden mean”), which is 1.61803399… In other words, to go forward in the sequence, you multiply the number by 1.618. To go backwards, you multiply by 0.618.
For example, in the series:… 55, 89, 144, 233, 377…144 * 1.618 = 233144 * 0.618 = 89
Primary Ratios:1.618 = The Golden Ratio0.618 = Inverse of 1.618 (1/1.618)
These ratios are found in nature, the human body, plants, DNA, the solar system, art, architecture, music, and even the stock market!
From this one number, 1.618, we can derive various other important numbers.
Primary Derived Ratios:0.786 = Square root of 0.6180.886 = Square root of 0.7861.130 = Inverse of 0.886 (1/0.886)1.272 = Square root of 1.618 (or the inverse of 0.786 (1/0.786))
Complementary Derived Ratios:0.382 = 0.618^2 (or 1 – 0.618)1.414 = Square root of 2.02.000 = Square root of 4.0 (or 1+1)2.236 = Square root of 5.02.618 = 1.618^2
Let’s also not forget the series generated by repeatedly multiplying 1.618… 2.618, 4.235, 6.854, 11.09, 17.94, 29.03, 46.97…
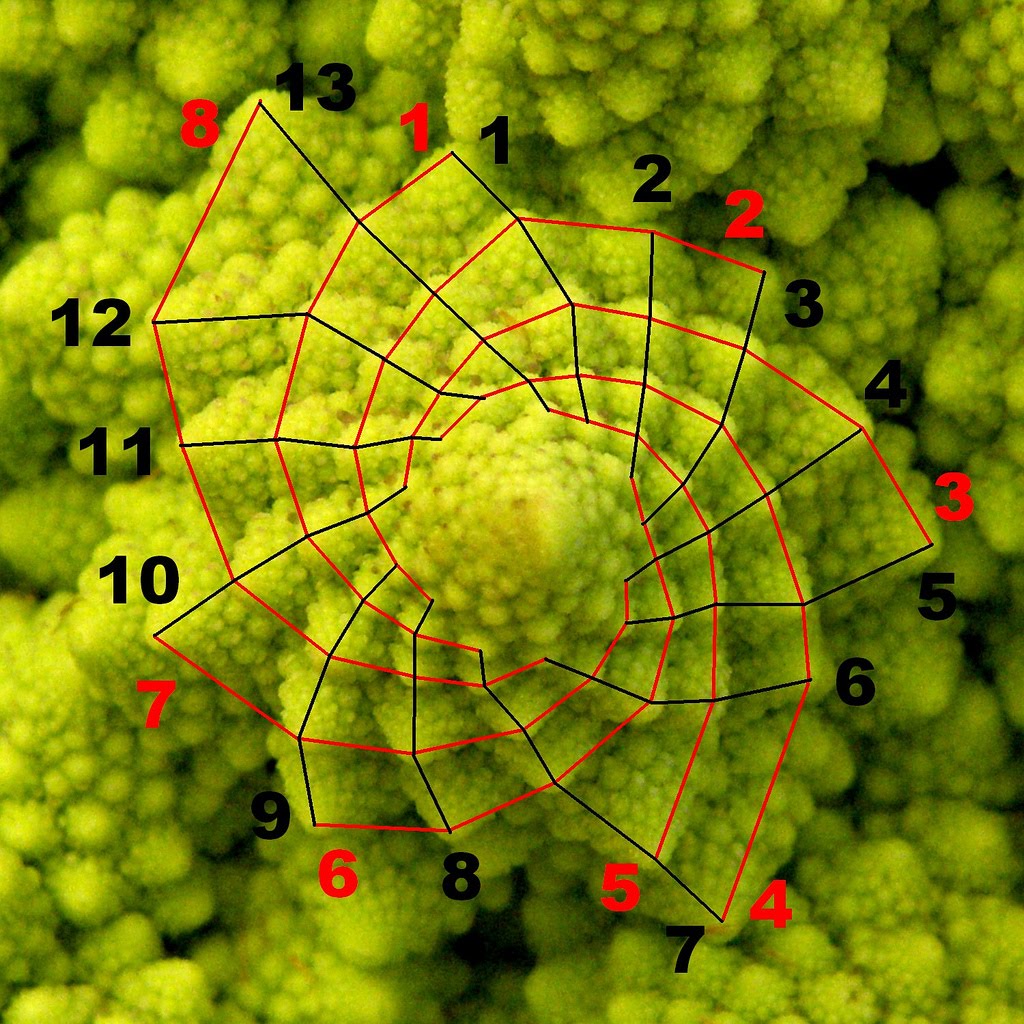 Next, we’ll go into the descriptions of the various harmonic patterns we look for on our charts. You will quickly notice that the above ratios make up most every ratio of every pattern! Coincidence?
For easy reference
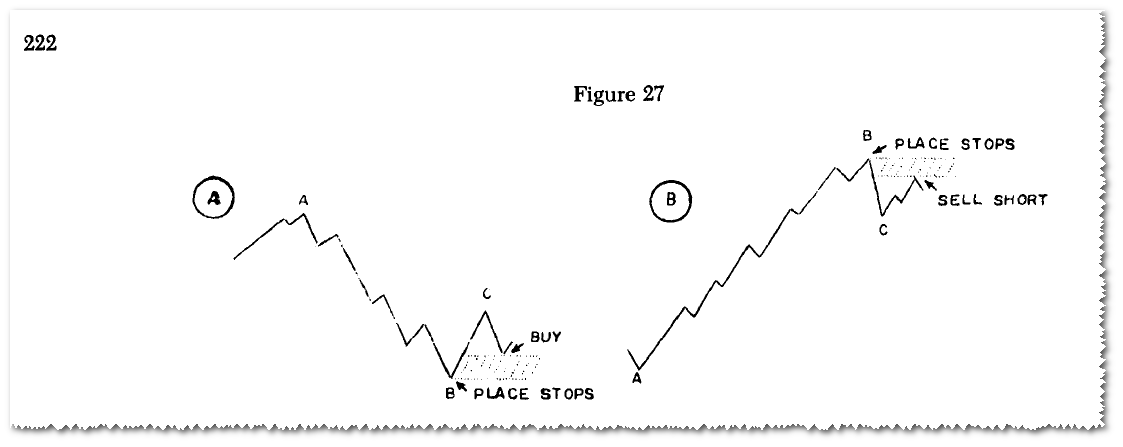
The Gartley pattern was outlined by H.M. Gartley in his book Profits in the Stock Market, published in 1935. Although the pattern is named “The Gartley,” the book did not discuss specific Fibonacci retracements!
The pattern is also known as Gartley 222, in reference to the page number the discussion of the pattern occurred.
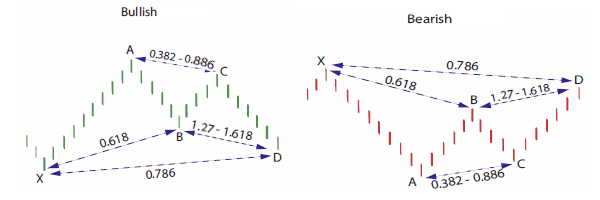
It was not until “The Harmonic Trader” by Scott Carney was released that the specific retracements of the B point at a 0.618 and the D point at a 0.786 were assigned to the pattern. There are others who have assigned Fibonacci retracements to this framework. However, they use a variety of Fibonacci numbers at the B and D points. Despite these variations, the Fibonacci retracements that yield the most reliable reversals are the 0.618 at the B point and the 0.786 at the D point. Furthermore, the pattern should possess a distinct AB=CD pattern that converges in the same area as the 0.786 XA retracement and the BC projection (1.272 to 1.618). The most critical aspect of the Gartley is the B point retracement, which must be at a 0.618 of the XA leg.
The structure of the Butterfly pattern was discovered by Bryce Gilmore. The Butterfly pattern must include an AB=CD pattern to be a valid signal. Frequently, the AB=CD pattern will possess an extended CD leg that is 1.27 or 1.618 of the AB leg. Although this is an important requirement for a valid trade signal, the most critical number in the pattern is the 1.27 XA leg. The XA calculation is usually complemented by an extreme (2.00, 2.24, 2.618) BC projection. These numbers create a specific D point that can yield powerful reversals, especially when the pattern is in all-time (new highs/new lows) price levels.
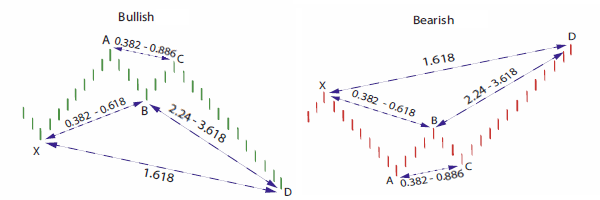
The Crab is a Harmonic pattern discovered by Scott Carney in 2001. The critical aspect of this pattern is the tight D point created by the 1.618 of the XA leg and an extreme (2.24, 2.618, 3.14, 3.618) projection of the BC leg but employs an 0.886 retracement at the B point unlike the regular version that utilizes a 0.382-0.618 at the mid-point. The pattern requires a very small stop loss and usually volatile price action in the D area.
The primary difference between a Crab and a Deep Crab is the retracement of point B. A Deep Crab has a much deeper retracement, yet keeps the same 1.618 projection of the XA leg to point D, which allows it to keep the same “Crab” name.
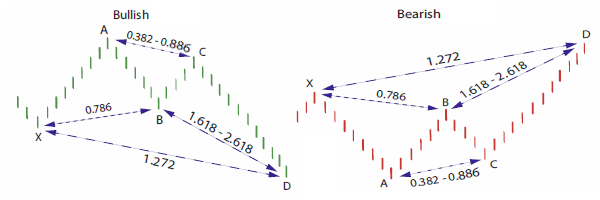
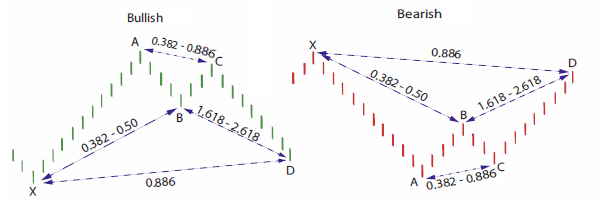
The Bat pattern is a precise harmonic pattern discovered by Scott Carney in 2001. The pattern incorporates the 0.886 XA retracement, as the defining element in the D area. The B point retracement must be less than a 0.618, preferably a 0.50 or 0.382 of the XA leg. The Bat utilizes a minimum 1.618 BC projection. In addition, the AB=CD pattern within the Bat is extended and usually requires a 1.27 AB=CD calculation. It is an incredibly accurate pattern and requires a smaller stop loss than most patterns.
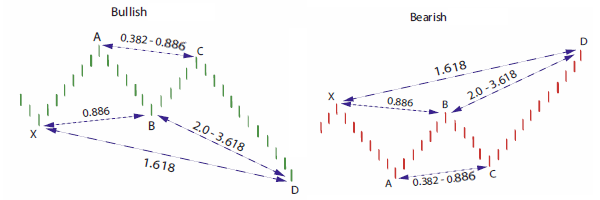
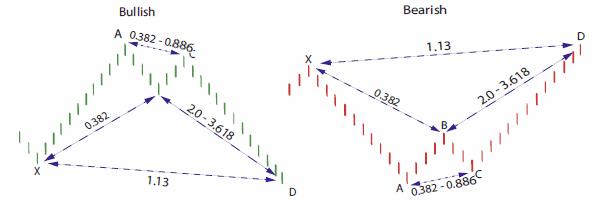
The Alternate Bat pattern is a precise harmonic pattern discovered by Scott Carney in 2003. The pattern incorporates the 1.13 XA retracement, as the defining element in the D area. The B point retracement must be a 0.382 retracement or less of the XA leg. The Alternate Bat utilizes a minimum 2.0 BC projection. In addition, the AB=CD pattern within the Alternate Bat is always extended and usually requires a 1.618 AB=CD calculation.
The Shark pattern is the first of our “class 2″ patterns, where point C exceeds the AB leg. As you can see, the pattern is very similar to the Bat, except for the location of C in relation to AB.
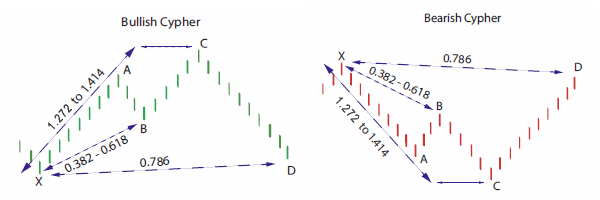
The Cypher pattern is the second of our “class 2″ patterns, where point C exceeds the AB leg. Other than using different ratios from the Shark pattern, the Cypher also looks for point C to be 1.272 to 1.414 projection of the XA leg, rather than the AB leg. This pattern was discovered by the team at TripleThreatTrading.com.
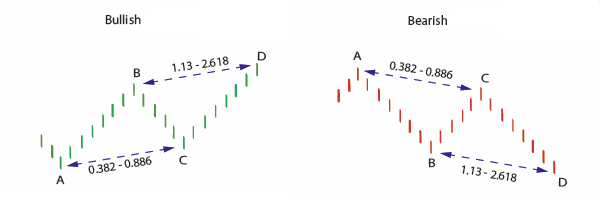
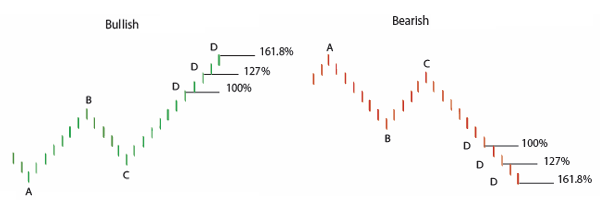
The AB=CD pattern is a price structure where each price leg is equivalent. The Fibonacci numbers in the pattern must occur at specific points. In an ideal AB=CD, the C point must retrace to either a 0.618 or 0.786. This retracement sets up the BC projection that should converge at the completion of the AB=CD.
Based on the retracement of point C, there are other extensions of the CD leg to look for. Namely, either a 1.27 or 1.618. When there is a 0.618 retracement at the C point, then look for a 1.618 BC projection. If there is a larger 0.786 retracement at the C point, then look for a 1.27 projection. The most important consideration to remember is that the BC projection should converge closely with the completion of the AB=CD.
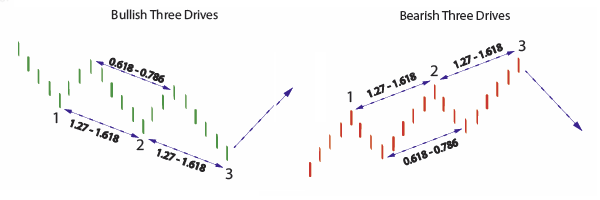
Although it was not specifically identified, one of the first references to a Three Drives Pattern was outlined in Robert Prechter’s book, “Elliot Wave Principle.” He described the general nature of price action that possessed either a three-wave or a five-wave structure. Adapted from this principle, symmetrical price movements that possess identical Fibonacci projections in a 5- wave price structure constitute a Three Drives pattern. In “The Harmonic Trader,” the patterns importance of other larger retracements and projections improved the accuracy of the pattern in real trading situations. The book was one of the first to emphasize the the critical aspect of this pattern that each drive complete precisely at consecutive harmonic ratios – either a 1.13, 1.27 or a 1.618. Also, the price legs should possess clear symmetry with each drive forming over equivalent time periods.
Fibonacci and harmonic patterns go hand in hand. These Fibonacci ratios are found in all aspect of nature and throughout the universe.
The market consists of thousands of traders whose bodies and minds also are built around these ratios, so it makes sense that they appear in the stock market as well.
This style of trading makes logical sense and builds upon many existing, proven styles.


No comments:
Post a Comment